
Monitor the status of the power grid directly in the browser.
I really wanted to take control of my apartment’s electrical system. Besides, running to the electrical panel every time isn’t exactly the admin approach. Admins are lazy, so all the information should be accessible right from their desks. And then, it’ll be something to brag about to my friends.
So, getting down to business… I decided not to describe the installation process of mosquitto and node red in this article, as my article mostly focuses on the hardware component of this project. I’d like to point out that I only managed to stabilize the device after several weeks of testing and debugging, so I think it’s very important to share this hard-won sketch with you. ;)
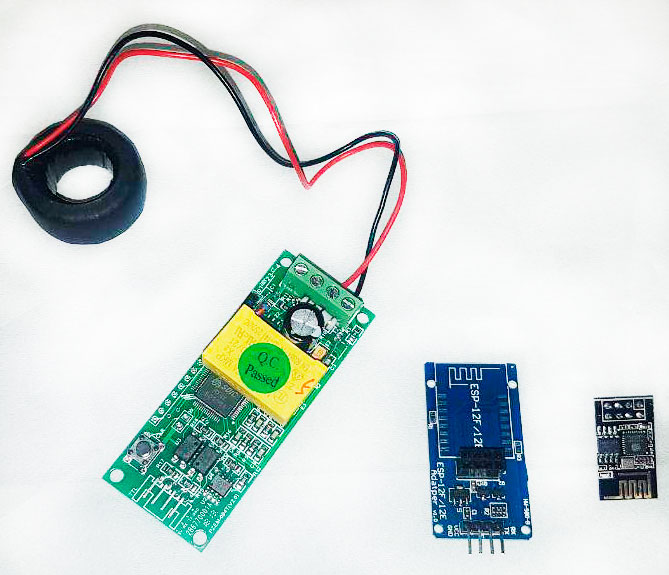
For monitoring, I decided to use the following components:
The PZEM-004T digital multimeter/meter can read voltage and power consumption from a 220V network. It features galvanic isolation to prevent breakdowns. It also has a built-in counter that operates independently of the device’s readings.
The ESP8266 ESP01s is the simplest and cheapest board based on the ESP8266 chip. It’s a microcontroller with Wi-Fi. Since this device operates at a 3.3V logic level, it comes with a bridge converter. This bridge allows you to power the device with a 5V source and connect to a 5V UART.
You’ll also need a 5V power supply, which are readily available at any electronics store. It’s recommended to use a unit with a minimum output of 0.5 amps.
Incidentally, I’m currently using an Orange Pi PC Plus as my smart home server. It handles it well, but I’d like to add an SSD, so I decided to splurge on the manufacturer’s most powerful hardware: the Orange Pi RK3399 . At the time of writing, the hardware is still on its way, so I’ll review it next time. Unfortunately, there’s virtually no useful information about this device online at this time.
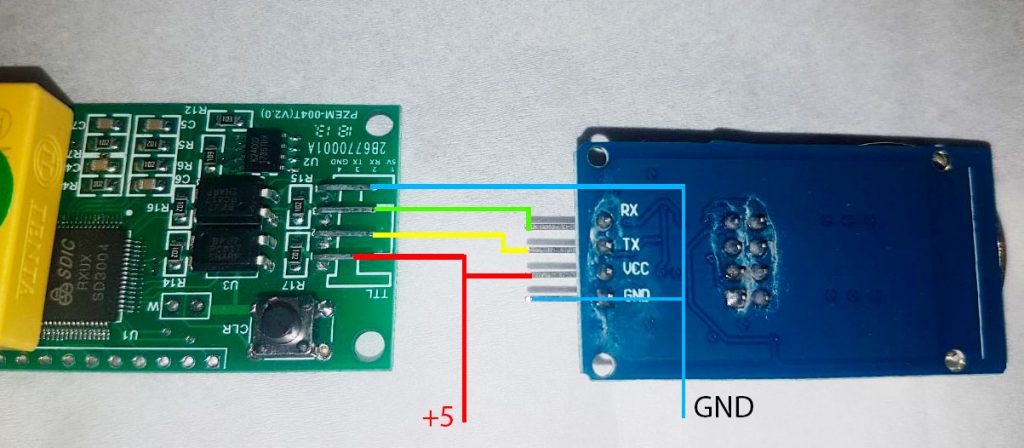
Since we’re dealing with galvanic isolation, it’s impossible to interrogate the PZEM-004t without connecting it to 220V, as it’s powered from both ends…
And now the most important part. A sketch for the esp01s.
#include
#include
#include
#include
#include
#include
double sens[4];
int pred;

PZEM004T pzem(3,1);  // RX,TX пины
IPAddress ip(192,168,1,1);

const char* ssid = "WIFI-SSID";
const char* password = "password";

#define MQTT_SERVER "192.168.1.254"  // Адрес MQTT брокера
#define mqtt_port  1883 // Порт
const char* mqtt_user="smart"; // Логин для MQTT
const char* mqtt_pass="password"; // Пароль


void callback(char* topic, byte* payload, unsigned int length) {

}
WiFiClient wifiClient;
PubSubClient client(MQTT_SERVER, 1883, callback, wifiClient);


#define BUFFER_SIZE 100

String macToStr(const uint8_t* mac){
  String result;
  for (int i = 0; i < 6; ++i) {
    result += String(mac[i], 16);}
  return result;
}

void re_connect() {
  if(WiFi.status() != WL_CONNECTED){
    WiFi.begin(ssid, password);
  } else {
      delay(7000);
  }
}

void setup() {
  ESP.wdtDisable();
  pzem.setAddress(ip);

  pinMode(2, OUTPUT);
  digitalWrite(2, LOW);    // выключаем светодиод
  re_connect();
  delay(100);
}

void loop(){
  if(WiFi.status() == WL_CONNECTED){
    client.connect("esp8266-AD14C5",mqtt_user,mqtt_pass);
    ESP.wdtFeed();
  } else {
    re_connect();
  }
  sens[0] = pzem.voltage(ip);
  if (sens[0] < 0.0) {
    sens[0] = 0.0;
  }
  if (sens[0] > 0){
    client.publish("home/sensors/electro/v",String(sens[0]).c_str());
  }
  if (sens[0] == 0.0 && pred == 0) {
    client.publish("home/sensors/electro/v",String(sens[0]).c_str());
  }
  pred = sens[0];
  delay(1000);
  sens[1] = pzem.current(ip);

  if(sens[1] >= 0.0){
     client.publish("home/sensors/electro/i",String(sens[1]).c_str());
   }
  delay(1000);
  sens[2]= pzem.power(ip);

  if(sens[2] >= 0.0){
    client.publish("home/sensors/electro/w",String(sens[2]).c_str());
  }

  delay(1000);
  sens[3] = pzem.energy(ip);

  if(sens[3] >= 0.0){
    client.publish("home/sensors/electro/wh",String(sens[3]).c_str());
  }
  delay(1000);
  client.loop();
}
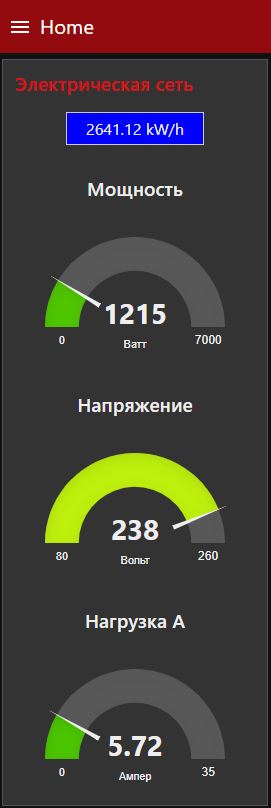
This is what my current data display looks like. In addition to the real-time display, I also created two graphs that show changes in readings over three days. I plan to track the electricity bill each month. :)